Spring Crop Insurance Prices Discovered
TOPICS
Soybeans
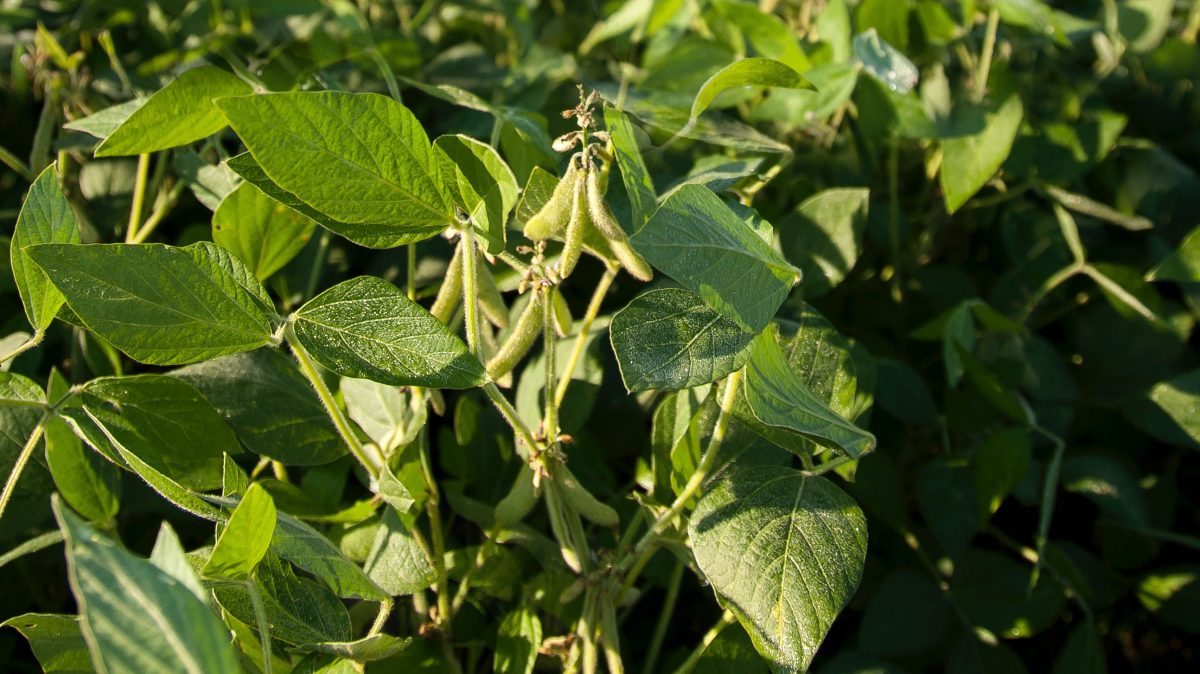
photo credit: Mark Stebnicki, North Carolina Farm Bureau
John Newton, Ph.D.
Former AFBF Economist
Every year USDA’s Risk Management Agency recalibrates crop revenue protection insurance policies to reflect updated market expectations of prices, price risk and revenue per acre. The crop insurance prices are determined by averaging Chicago Board of Trade (corn and soybeans) and Intercontinental Exchange (cotton) futures contract settlement prices during a month-long price discovery period.
Spring prices for corn, cotton and soybeans are determined by averaging the new-crop futures contract settlement prices (December for corn, November for soybeans and December for cotton) during the month-long February price discovery period. Following the spring price discovery period, farmers may purchase revenue protection policies that provide insurance against yield declines. In the event of a crop loss, a farmer purchasing a harvest price option policy would be indemnified at the higher of the spring planting price or the price during harvest. Farmers without the harvest price option would be indemnified at the spring planting price. A recent Market Intel reviewed 2017 Crop Insurance Prices.
At the end of February USDA’s Risk Management Agency showed ‘in discovery’ spring prices for corn, cotton and soybeans at $3.96 per bushel, 76 cents per pound and $10.16 per bushel, respectively. The spring price for corn is unchanged from 2017 and the soybean price is down 3 cents per bushel from 2017. The soybean-to-corn spring price ratio remains at 2.57, in line with last year and well above the 20-year average of 2.25. For cotton, the spring price was 2 cents per pound above last year’s spring price and the highest spring price since 2014. Spring and harvest prices are presented in Figure 1.

Implications for 2018 Plantings
While the spring price discovery is important for crop insurance policies, many in the trade also use the spring prices to evaluate potential acreage shifts for the upcoming crop year. USDA currently projects corn acreage in 2018 at 90 million acres, down 0.2 percent form 2017. For soybeans, USDA projects 90 million acres planted in 2018, down 0.1 percent from 2017. For cotton, USDA projects 13.3 million acres planted in 2018, up 5.6 percent from last year and the highest cotton acreage since 2011. Stronger spring cotton prices support the expectation that cotton acreage will increase in 2018.
For corn and soybeans, however, the projected acreage changes are not aligned with historical acreage and price relationships. Based on historical acreage data from 1996 to 2017, when the spring price ratio is greater than 2.2, a positive change in soybean acreage is expected. Alternatively, when the spring price ratio is above 2.4, a negative acreage response is expected for corn, Figure 2. It’s important to note that only 35 percent and 13 percent of the deviations from trend are explained for soybeans and corn, respectively. The poor fit suggests that the model is reliable only in predicting the direction of acreage changes. However, last year, when the price ratio was 2.57, soybean acreage increased by 8 percent to 90.1 million acres and corn acreage decreased 4.1 percent to 90.2 million acres.

Given that this year’s price ratio is also 2.57, an increase in soybean acreage and reduction in corn acreage would be expected. However, at the most recent Agricultural Outlook Forum, USDA projected that both corn and soybean acreage would decline in 2018. For soybeans, specifically, this projection goes against conventional wisdom in the trade when evaluating historical planting and price relationships. Something has to change. Either the soybean-to-corn price ratio needs to decline, i.e. buy corn acres or sell soybean acres, or this predictor of the direction of acreage changes will fall apart in 2018.
The next opportunity to evaluate potential crop acreage will be the March 29 Prospective Plantings report. The prospective plantings report gives the first estimate of the area farmers are expected to plant to row crops for the upcoming year based on survey responses during the first two weeks of March. This report will remove some of the uncertainty on likely acreage decisions. Importantly, it will also answer a lingering question now facing the industry: Will the U.S. plant more or fewer soybeans in 2018? For this question, model results and USDA forecasts disagree.
Trending Topics
VIEW ALL