Grain Storage Capacity Can Buffer Impact of Transportation Disruptions

photo credit: Arkansas Farm Bureau, used with permission.
Daniel Munch
Economist
Mississippi River water levels have reached record lows in the first half of October. At Memphis, for example, the river stage, or height of the river’s surface relative to the zero-stage level of 189.9 feet, fell to a record low of minus 11.5 feet on Oct. 11. This is lower than last year’s record low of minus 10.81 feet at Memphis. As described in previous articles including Severe Weather and Low Mississippi River Levels Bring Uncertainty to Harvest and Low Mississippi River Levels Drive up Grain Transportation Costs, these low river levels have reduced and delayed barge traffic and increased transportation costs for farmers during peak harvest season. One factor that helps mitigate the impact of transportation disruptions is the quantity of available grain storage in on-farm and off-farm facilities. Understanding trends and regional differences in storage availability provides insights on how well grain stocks and newly harvested grain can be held when transportation conditions are uncertain.
From ocean port congestion and labor strikes to low river levels, railway service shortfalls and a nexus of state and federal freight regulation, farmers and ranchers are well acquainted with transportation disruptions. One effective albeit costly way to buffer against these disruptions is investment in on-farm and off-farm storage. Having sufficient storage capacity close to agriculturally productive regions means farmers can have a place to offload harvest if downstream transportation options are too expensive or unavailable. If storage is unavailable, farmers will be forced to absorb elevated transportation costs, face steep price cuts to get product moved or risk crop quality losses.
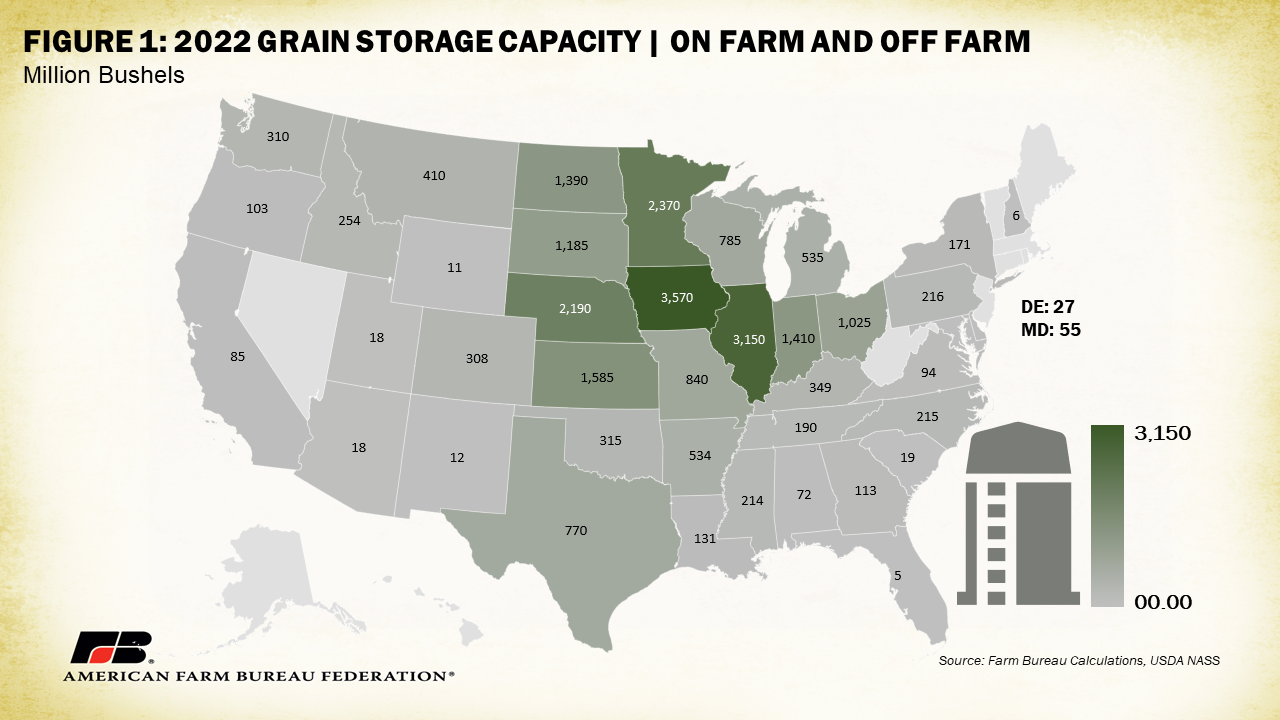
USDA’s latest Grain Transportation Report from the Agricultural Marketing Service highlighted National Agricultural Statistics Service data on grain storage capacity for both on-farm (including bins, cribs and sheds used to store grains and oilseeds on farms) and off-farm facilities (including elevators, warehouses, terminals, mills and crushers). As of Dec. 1, 2022, the U.S. had 25.4 billion bushels worth of total grain storage capacity: 11.8 billion (47%) of off-farm storage and 13.6 billion (53%) of on-farm storage. Figure 1 displays the total capacity for grain storage (on-farm and off-farm) by state as of Dec. 1, 2022. As expected, the bulk of grain storage is in heavy grain-producing heartland states. Iowa leads with 3.57 billion bushels worth of storage capacity followed by Illinois (3.15 billion) and Minnesota (2.37 billion).
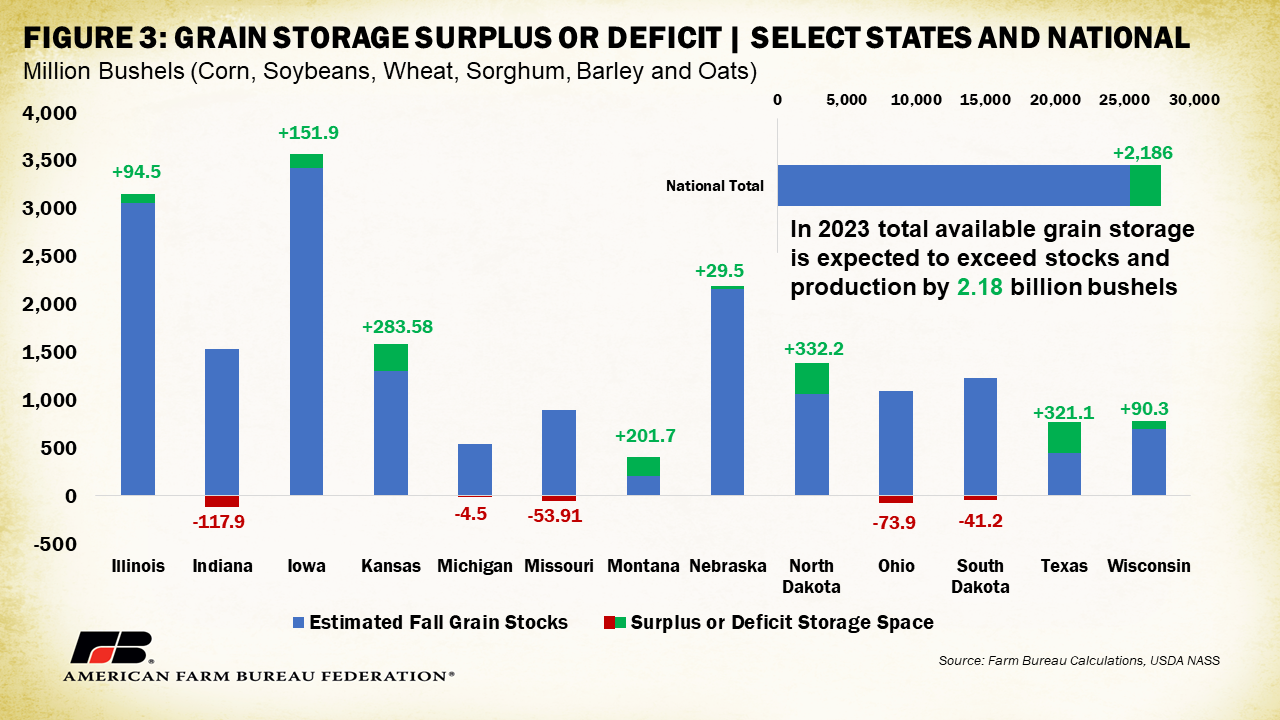
As of Sept. 1, 2023, farmers and commercial grain facilities held 3.69 billion bushels of grain in storage, a marginal 16-million-bushel, or 0.4%, decline from last year but down 25%, or 933 million bushels, from the prior five-year average. On-farm grain stocks made up 39% of total grain stocks. Combining current grain stocks with expected fall harvested crops (corn, soybeans and sorghum) puts total grain supply at approximately 23.12 billion bushels. Comparing this to the total storage capacity of 25.4 billion bushels shows the U.S. has about 2.18 billion bushels of surplus grain storage space. Any supply dynamics that would cause stocks to breach this 25.4-billion-bushel threshold would exceed existing storage infrastructure.
The concept of a grain storage surplus, however, is not uniform across all states. Some states have a storage deficit, making them more susceptible to the impacts of transportation disruptions. Figures 2 and 3 display state-by-state grain storage capacity surplus or deficits based on current stock and production estimates.
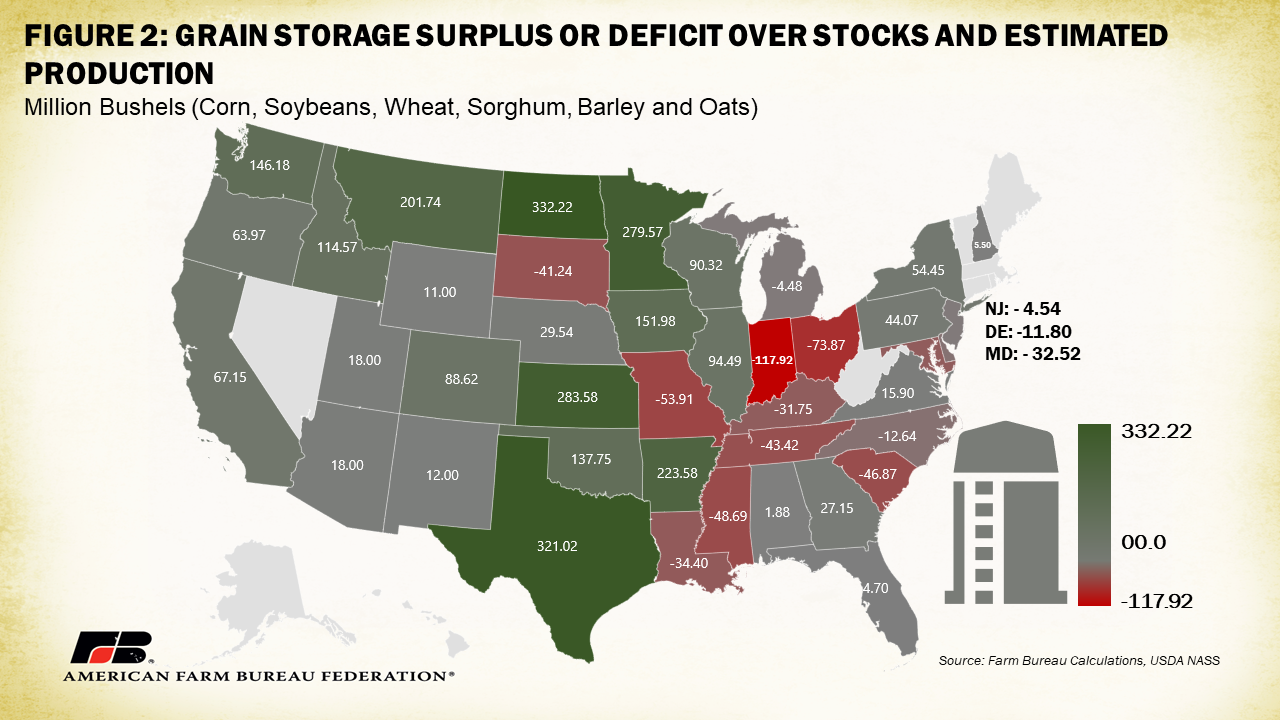
Notably, not all heartland states are created equal in terms of grain storage availability. While states like North Dakota and Minnesota have a large surplus of available space (332 million bushels and 279 million bushels, respectively), states like Indiana and Ohio have a significant storage deficit (-117 million bushels and -73 million bushels, respectively). Several other states reliant on the Mississippi River for grain transport face low grain storage availability, such as Missouri (-53 million bushels), Kentucky (-31 million bushels), Tennessee (-43 million bushels), Mississippi (-48 million bushels) and Louisiana (-34 million bushels). Worsening conditions in this region mean product has few places left to go since it cannot be easily moved to downstream buyers. Shifting to costlier rail or trucking services often becomes a last resort.
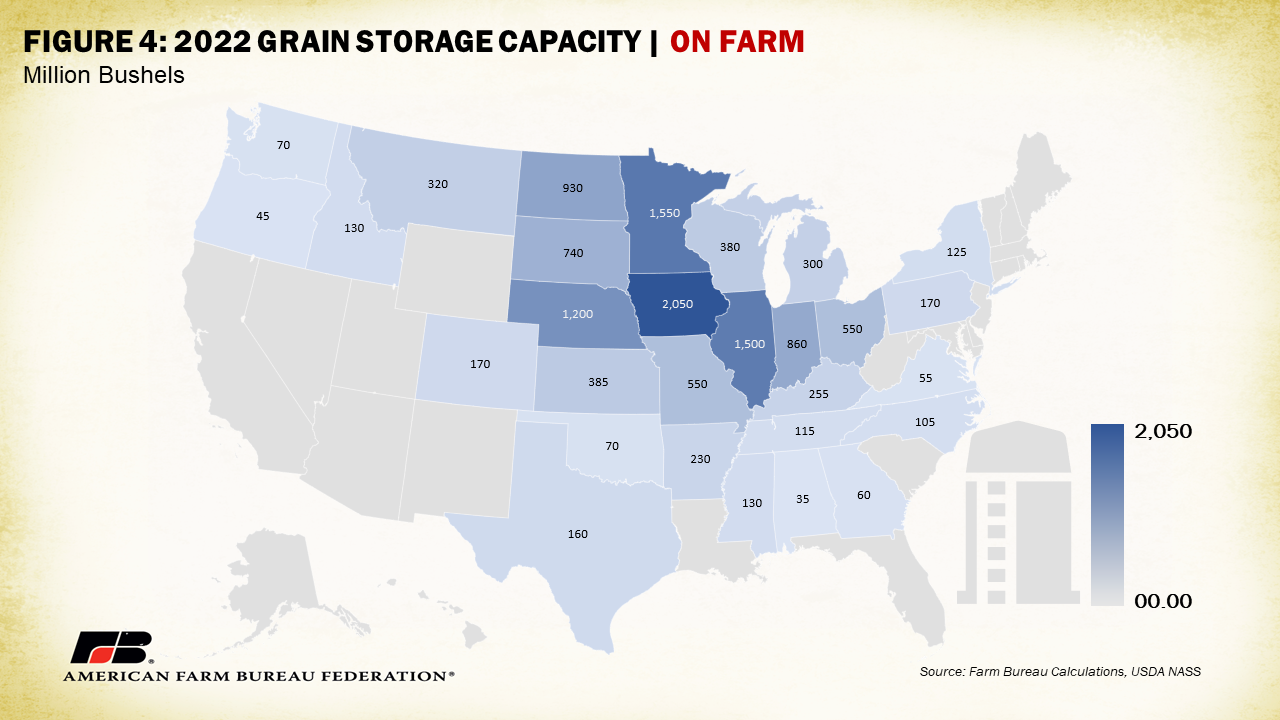
Analyzing on-farm and off-farm storage trends can reveal which states have seen the most growth or loss of storage capacity. On-farm storage allows farmers the most flexibility in terms of weathering external market disruptions. Farmers are only reliant on themselves and their own equipment and capacity restrictions in getting grain stored under this category. Once grain leaves the farm, that storage is no longer accessible for that crop, shrinking the practical storage capacity of the broader market. The more on-farm storage available to farmers the more control farmers have on the marketing of their crop which influences final received prices. On-farm storage has made up an average of 54% of total storage capacity for the past five years.
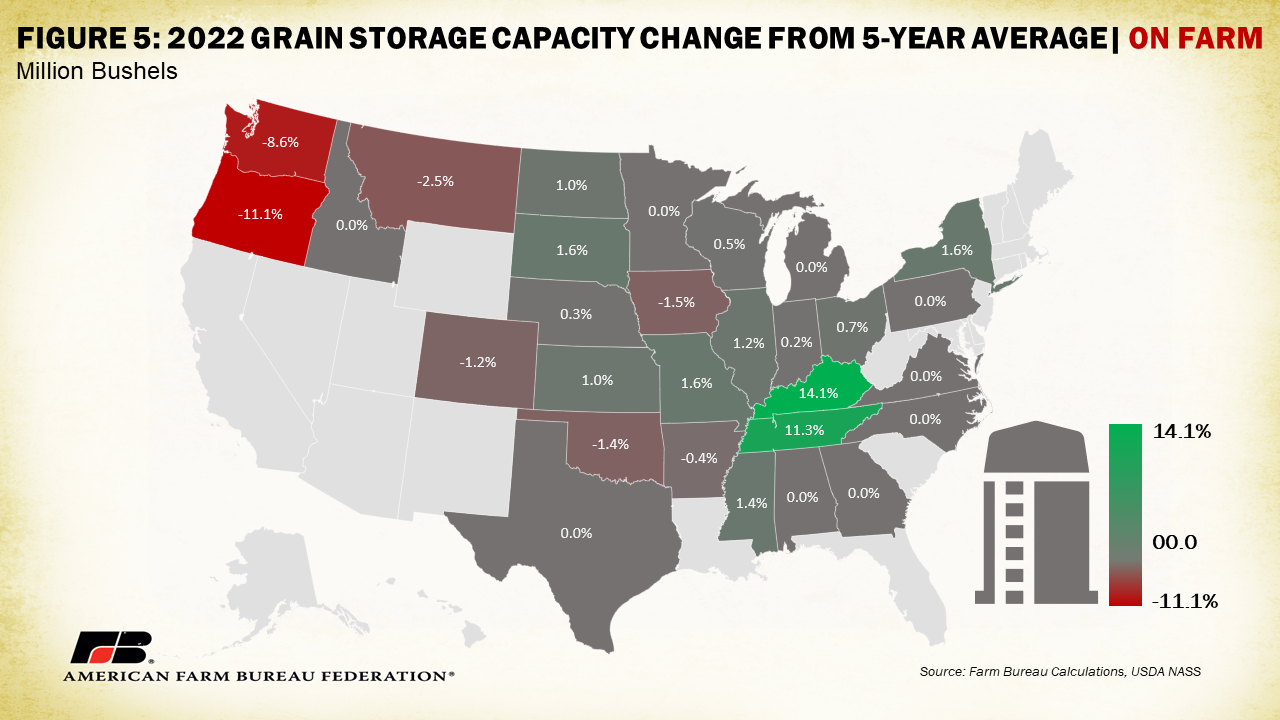
Mirroring the distribution of total storage capacity, Iowa leads as the state with the highest on-farm storage capacity with space for 2.05 billion bushels, followed by Minnesota (1.55 billion) and Illinois (1.5 billion). Compared to the prior five-year average, most states have seen little change in available on-farm storage for a national increase of 0.6% or 76 million bushels. Tennessee and Kentucky have far outpaced this national percent increase with an 11% and 14% increase, respectively. Tennessee and Kentucky faced severe, storage-destroying storms in late 2021. The availability of several federal cost-share programs to fund the reconstruction of expanded facilities could be the cause for these larger-than-average increases. On the other end, Oregon and Washington had a significant decrease in on-farm storage (-11% and -8.6%, respectively). Reasons for these localized declines are difficult to isolate but may be linked to the declining number of farms in the region generally or ongoing political efforts to breach Columbia River dams that have made maintaining and investing in grain markets riskier. The less on-farm storage available, the more pressured farmers are to deliver grain immediately after harvest.
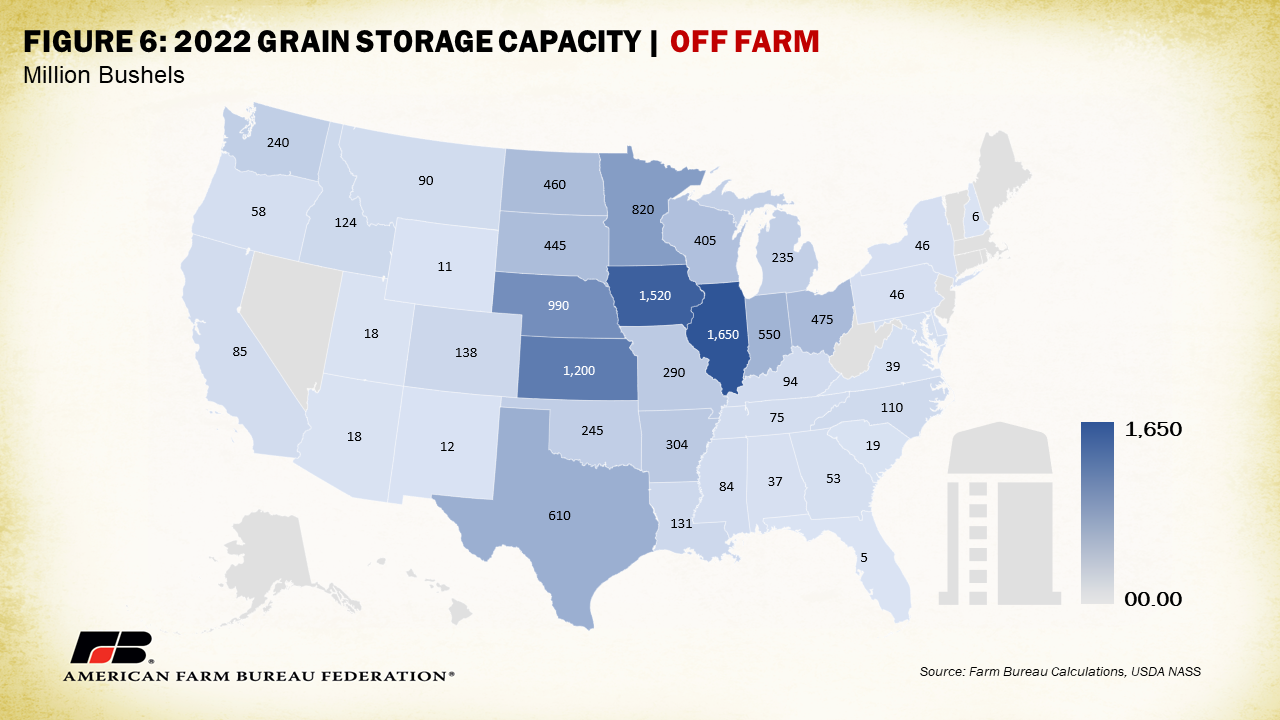
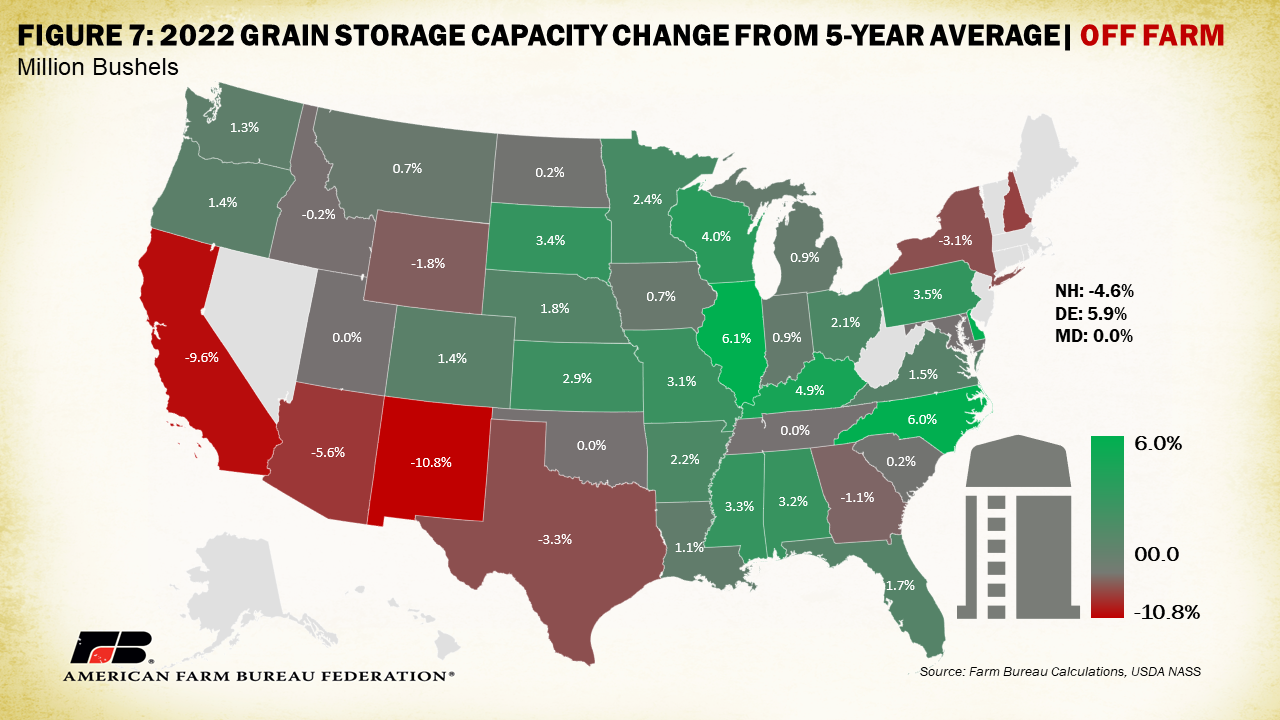
Off-farm storage has made up an average of 46% of grain storage capacity for the last five years. Farmers reliant on storage under this category may still be reliant on external transportation services to get grain stored (e.g., a shuttle rail service, trucking company or waterway), opening producers to more cost risk. Illinois leads as the state with the highest off-farm storage capacity with 1.65 billion bushels worth of grain storage capacity. Illinois is followed by Iowa (1.52 billion) and Kansas (1.2 billion). Compared to the prior five-year average, national off-farm storage is up 2% or 241 million bushels. Most grain-heavy states have seen an increase in off-farm storage from the prior five-year average. Illinois had the highest increase – 6.1% – followed by North Carolina (6%) and Kentucky (4.9%). The Southwest faced the most significant loss in off-farm storage with New Mexico down 10.8%, California down 9.6% and Arizona down 5.6%. Perhaps persistent drought conditions have foiled continued upkeep in larger-scale grain facilities, though other localized factors are likely at play.
Storing grain for longer periods of time raises other farm financial considerations. The cost of holding grain has not been spared from high interest rates or increasing costs for labor, energy and other operating expenses. Interest expenses can make up a quarter to a third of a grain elevator’s total cost of storing grain, shrinking the bids farmers may receive for their crops and increasing the supply of grain (not being stored) on the market. Farmers also often have large sums of money tied up in grain inventory (based on capital they borrowed for the season’s expenses), which can be paid back with the proceeds from the sale of grain. If that grain continues to be stored, those farmers are on the hook for more interest payments and continue to have much of their capital tied up.
Basis, the difference between the current local cash price and a relevant futures contract price for a certain time period, is impacted by both storage costs and transportation availability. A negative basis value represents a cash price under a futures price while a positive value represents a cash price over the futures price. A basis that becomes more positive is often described as “narrowing,” while a basis that becomes more negative is considered to be “widening.” When basis is more positive or narrower than usual the market is sending a signal to make more cash sales within a region, while a widening basis would signal that the market is discouraging cash sales and it may be a better bet to store crops. These dynamics are important to understanding local demand. Higher transportation costs due to disruptions can widen basis, discouraging movement of grain to impacted regions. Higher storage costs have a similar but opposite effect, narrowing basis when cash prices increase in response. Tracking basis can help farmers determine whether storing or selling crop will provide the better price.
Conclusion
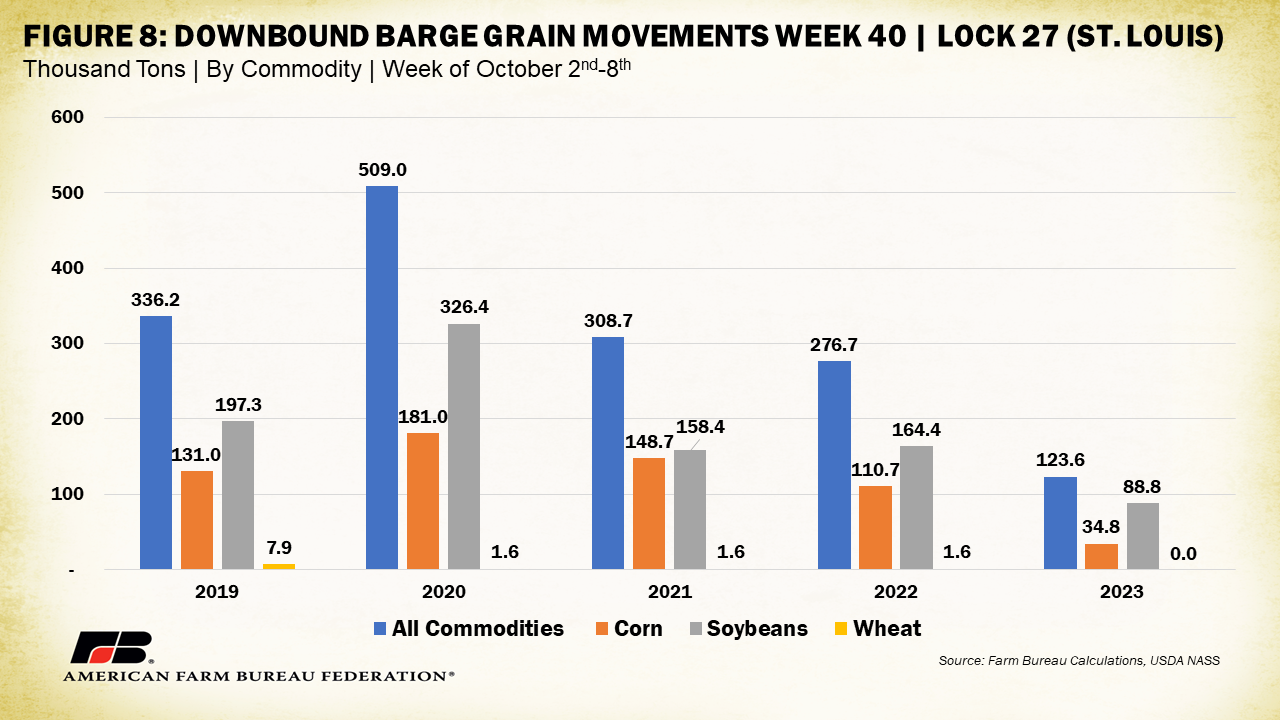
A general increase in both on-farm and off-farm storage is a good sign for farmers facing uncertain transportation conditions. For most states and nationally, existing storage exceeds stocks and fall harvest expectations, providing a positive marketing safety net. In other states, farmers will be more exposed to risk when their crops cannot be easily moved. For the 40th week of 2023, downbound grain movements of corn, soybeans and wheat at St. Louis are far below previous years. Compared to the same week last October, total commodity movements were down 55%, or 153,000 tons, with corn down 69% (76,000 tons), soybeans down 46% (75,000 tons) and wheat down to zero. Farmers in Indiana, Ohio and Missouri will face hurdles in dealing with harvested grain this season. Finding an alternative to river transportation for excess crops will likely be necessary. Long-term risk management plan discussions for commodity growers should include on-farm storage availability, a great but costly way to hedge against current and future transportation risk. Additional on-farm storage capacity provides farmers more control of product marketing and a leg up on the ultimate price they receive for their crop.