Grain Glitch No More

photo credit: Mark Stebnicki, North Carolina Farm Bureau
Veronica Nigh
Former AFBF Economist
Grain Glitch Defined
The grain glitch was an unintended consequence of Section 199A, the provision that created the 20 percent tax deduction on income derived from pass-through businesses designed to replicate the tax benefits accorded to farmer-owned cooperatives and their farmer-patrons under the previous Section 199, also known as the Domestic Production Activities Deduction. However, the new 199-A provision had the impact of creating a disparity between marketing products to cooperatives versus non-cooperatives.
The disparity comes from the fact that pass-through business owners who belong to co-ops are currently able to take a deduction for 20 percent of qualified cooperative dividends received from agricultural or horticultural cooperatives – in addition to the pass-through business deduction described above. As many in the agricultural sector noted, including many farmers, this provision would very likely incentivize farmers to sell their products to cooperatives rather than to a private or investor-owned company in order to receive a significantly larger tax deduction.
A Co-op Nation
According to the latest data from USDA Rural Development (2016), there were 2,047 agricultural co-operatives in the United States. Of that number, 86 were primarily service cooperatives, 827 were primarily farm supply cooperatives and the other 1,040 were primarily marketing cooperatives. This data does raise the question -- if there are agricultural co-ops all over the United States marketing a wide variety of their members’ crops, why did the tax provision gain the moniker “grain glitch”?
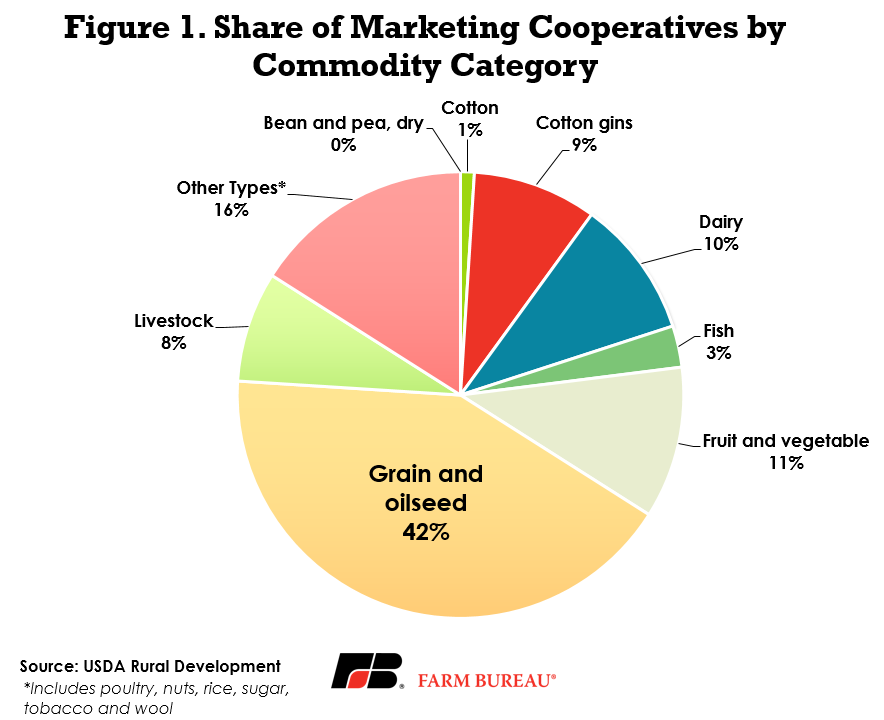
When those marketing cooperatives are further classified by the majority of business volume from the sale of a particular product, we can better understand why this issue was of heighted concern to different commodities. Figure 1 reveals that marketing co-ops are heavily concentrated in a few products: 10 percent market dairy products, 11 percent market fruits and vegetables, 42 percent primarily market grain and oilseed products, 9 percent market ginned cotton and another 8 percent market livestock. Combined, these five products account for more than 80 percent of all marketing cooperatives.

A deeper dive into a few of these products tells us even more. For example, according to USDA, dairy co-ops handled more than 80 percent of the nation’s milk, the highest market share of all the commodities handled by ag co-ops. Co-ops are certainly important to certain fruits and vegetables, but in the big picture of the fruit and vegetable industry just within California, the largest fruit and vegetable producing state, co-ops only represent about 15 percent of total marketings.
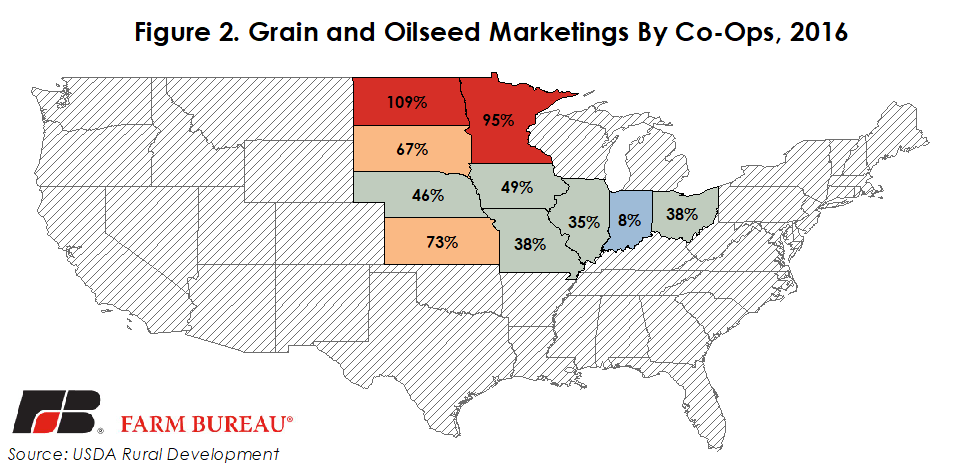
Grains and oilseeds are a different matter entirely. Corn is grown in most U.S. states, but the top five corn-producing and soybean-producing states (2016) - Iowa, Illinois, Nebraska, Minnesota and Indiana - represent more than 50 percent of total corn production and more than 60 percent of total soybean production. However, the share of total grain and oilseed production marketed by co-ops in each of those five states significantly varies. Minnesota, with the largest number of ag co-ops headquartered in any state, has the largest share of production marketed by co-ops at more than 90 percent. In Indiana, on the other hand, less than 10 percent of grain and oilseeds are marketed through co-ops. Illinois, Iowa and Nebraska range between 35 and 50 percent of production marketed through co-ops.
These estimates aren’t perfect – we compared gross business volume to cash receipts in each state. We know corn and soybeans grown near a state border may find their way into the neighboring state. For example, grains and oilseeds marketed through North-Dakota co-ops is greater than the volume of grains and oilseeds grown in the state due to shipment of grains and oilseeds across state boundaries. Regardless, the measurement gives a general idea of why the “grain glitch” became such a significant issue for farmers and grain marketers throughout the United States. Simply put, there is substantial competition among grain merchants for farmers’ corn and soybeans and the changes made to the tax code in December could have significantly changed that supply chain.

Issue Resolution
After much debate and hard work, the Senate Finance Committee and House Ways and Means Committee released a summary of changes to the Section 199A provision, which can be found here. The proposed changes are retroactive to Jan. 1, 2018 and are available to pass-through businesses (sole-proprietors, partnerships, S corporations).
Pass-through Business Deduction
Pass-through business owners with taxable income below $157,000 per individual or $315,000 on a joint return can take a business deduction that equals 20 percent of their net income from commodity sales up to the farmer’s taxable income. The deduction is restricted when taxable income exceeds the thresholds.
When commodities are sold to a cooperative, the deduction is reduced by either 9 percent of the net income from the farmer’s cooperative sales or 50 percent of wages attributed to such sales, whichever is less. However, the farmer is able to claim any deduction passed through from the cooperative up to the farmer’s taxable income, including capital gains.
Cooperative Tax Deduction
Cooperatives have a deduction of the lesser of 9 percent of adjusted gross income or 50 percent of W-2 wages and have the option of retaining their deduction or passing some of their deduction to their patrons.
As a result of the changes, a farmer who operates a pass-through business and sells product to a co-operative will not know the full value of their deduction until it is decided what share of the cooperative’s deduction will be retained or passed back to patrons. The examples below, which assume all production sales are made to a cooperative, highlight the range of the deduction.
Example A (High Wages, Full Pass-through from Co-op)
20% deduction
- 9% reduction
+9% deduction pass-through from co-op
20% deduction
Example B (High Wages, No Pass-through from Co-op)
20% deduction
- 9% reduction
+0% deduction pass-through from co-op
11% deduction
Example C (No Wages, Full Pass-through from Co-op)
20% deduction
- 0% reduction
+9% deduction pass-through from co-op
29% deduction
Example D (No Wages, No Pass-through from Co-op)
20% deduction
- 0% reduction
+0% deduction pass-through from co-op
20% deduction
Bottom Line
A farmer who operates a pass-through operation and sells grain to a private company know with certainty that he will receive a section 199a business deduction worth 20 percent of his net income from sales. A farmer who operates a pass-through operation and sells grain to a co-op knows that he will receive a section 199a business deduction, but will not know the full value of his deduction until he knows how much his cooperative is passing through to patrons. The business deduction the farmer who sells to the cooperative receives will range between 11 percent and 29 percent of net income from sales, depending on both his operation’s W2 wages and the size of the deduction passed through to him by his cooperative. The variability of the deduction re-balances the competitive landscape and makes it similar to the one that existed prior to the passage of the Tax Cuts and Jobs Act.
Trending Topics
VIEW ALL