Early June 2021 Crop Condition Report Paints an Overly Rosy Picture
TOPICS
USDAShelby Myers
Economist

photo credit: Tennessee Farm Bureau, Used with Permission
Shelby Myers
Economist
USDA’s weekly Crop Progress report indicates that as of June 6 farmers have planted all of their intended acres or are nearing completion of planting. The report does not take into account whether or not farmers planted more of one crop than they originally indicated in the March Prospective Plantings report. This week’s report is also an early look at crop conditions and how select crops are faring in the latest weather swings. Jumping from colder than usual temperatures to high heat, crop conditions are unlikely to stay this favorable for long, especially if drought conditions worsen. These weather shocks are likely to impact estimates for crop supply in the 2021/22 marketing year as demand continues to increase and push prices toward their highest levels since 2013 (see First Look at 2021/22 Marketing Year Following Sky-Rocketing 2020/21 Export Demand).
Planting Progress
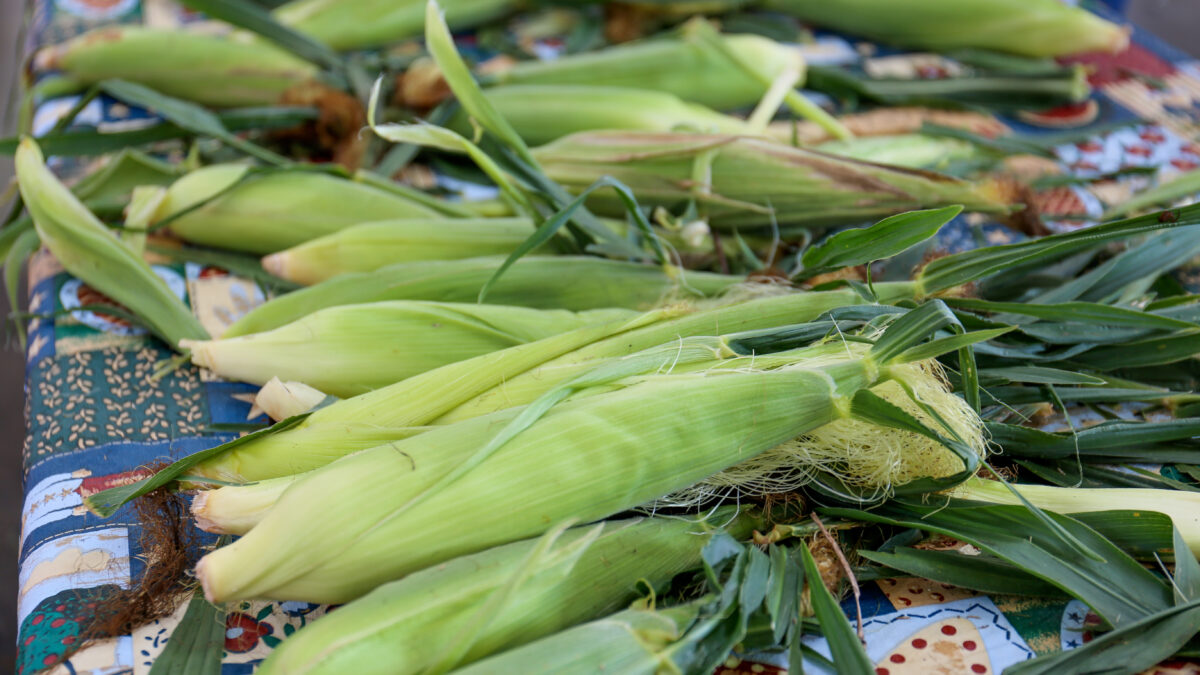
As of June 6, farmers have planted all of their intended corn acres. Last week’s report shows that 95% of intended corn acres were planted, which is just slightly above the 92% progress reported for the same week last year. Leading the way were farmers in North Carolina, who finished before the report, followed by Iowa and Minnesota at 99% and South Dakota and Tennessee at 98%.
For 2021 soybeans, U.S. farmers have planted 90% of intended soybean acres as of June 6, which is 6% higher than the pace of soybean planted acres last year at this time, when 84% of intended soybean acres had been planted. Minnesota has reported all soybean planted acres have been completed, while Iowa and Nebraska are just behind at 98% and Michigan and South Dakota are at 97%. Figure 1 displays soybean planting progress of intended acres as of June 6.

Cotton acres planted across the U.S. are slightly behind last year’s planted acreage in late May/early June. 2021 cotton planting progress sits at 71% of intended cotton acres, whereas last year U.S. farmers had planted 76% of intended 2020 cotton acres by this time. Leading the way in planted cotton acres is California, which has completed planting, followed by Arizona at 99%, and Arkansas and Missouri at 98%. Figure 2 displays cotton planting progress of intended acres as of June 6.

Crop Conditions
As 2021 planting heads toward a close, all eyes turn to weather. Top of mind for farmers across the U.S. is how persisting drought conditions will impact crop conditions. For the week ending June 6, 75% of the 2021 corn planted was rated good or excellent, with 90% of planted corn acres with some variation of emergence. At this same time last year, only 87% of the 2020 corn acres had emerged. For soybeans, 72% of planted acres were rated good or excellent, with 76% showing some variation of crop emergence compared to 65% of emergence this same week in 2020. Of cotton planted acres, only 43% of the 2021 crop is indicated to be in good or excellent condition, with another 44% sitting at fair condition. However, the rate of cotton squaring is only at 9% of the 2021 crop. In 2020, 12% of cotton acreage was squaring at this point in the year.
The National Oceanic and Atmospheric Administration published its monthly national temperature and precipitation maps on June 8. According to NOAA, in many parts of the country, May temperatures were some of the coldest on record, especially across the middle of the country, where planting has rapidly progressed. Crop emergence is heavily dependent on warming temperatures that initiate plant growth. This spike in temperatures has just started in areas where the temperature has been below average. Figure 3 is the May 2021 NOAA map that compares the temperature of the current month and year as percent relative to the same month’s mean temperatures starting in 1895.

In drought-stricken areas, temperatures in May were much higher than average with little moisture. Drought conditions continue to make farmers wary of what the 2021 crop will look like. In parts of the West and Southwest, especially western Arizona and southern California, record drought conditions were already emerging in April. The latest precipitation maps (May 2021) show it is record dry in those areas of the West. Moving east, above average rains and even record rains for this month occurred in eastern Colorado and western Kansas, as well as along the Gulf Coast in Texas and Louisiana. Figure 4 is the May 2021 NOAA map that compares the precipitation of the current month and year as a percent relative to the historic mean precipitation during the same month since 1895 through May 2021.

Summary
As summer heats up, farmers’ attention will shift toward weather patterns and growing conditions, which so far have not been ideal. Warmer than usual temperatures and persisting dry conditions are culminating in a drought in the West, while much of the rest of the U.S. has had cooler than normal temperatures and divergent precipitation levels. So far, USDA’s weekly Crop Progress reports do not include any information about whether farmers have changed their intended planted acres as originally reported in March. The June Acreage report released on June 30 will be the next update to supply estimates for the 2021/22 marketing year, but crop conditions will continue to be reported weekly, providing some insight into how crops will fare. If weather conditions result in supplies dropping from current expectations, we could potentially see commodity prices rise again, provided the current outlook for demand remains strong.
Trending Topics
VIEW ALL